

Every once in a while, when I upload pieces like the one above to social media, such as Facebook, Twitter, Instagram or Reddit, someone asks for an explanation of the process to produce it. It’s not super complex, but it is a little involved. So, in this post, I’m going to describe the basic process; complete with diagrams.
So strap yourself in, set your tray in the upright and locked position. We’re about to take off for the Twisted Geometries Zone.
Imagine a square. An invisible square, with only the vertical sides showing. Also, imagine that the two lines have four points each. All four points are equidistant from each other, starting at the top, and ending at the bottom.
We’ll get back to those points. Even though they are co-linear, we’ll call them inflection points. And the lines are key lines. Since there will be more key lines, and they’ll be between these first key lines, we’ll call these end key lines. It’s important to have names for every part of the image we’re creating; otherwise we’ll drown in a sea of lines and points.
Speaking of nomenclature, this square that we’re working on is called an element.
Now we add another key line. There are a number of things to note about our new key line:
- it has the same number of inflection points as the end key lines;
- its inflection points are neither co-linear nor equidistant;
- the top and bottom are fixed at our invisible square’s border, but seem to be able to move along that border.
We’ve also introduced a new item into the mix: the constraint. It’s that light blue dotted line which separates the top and bottom of the square. This constrains the inflection points to be randomly positioned anywhere within its boundaries. Here are a few examples:
The dots and dashed lines aren’t usually included. So let’s try that again without these aids:
Looks kind of naked, doesn’t it? Time to introduce tween lines.
Here we’ve added 3 tween lines, which appear in a sky blue, and we’ve reinstated our inflection point dots and constraint line so we can clearly see what is happening.
The tween lines are calculated using the delta between two pairs of inflection points on two adjacent key lines. For example, the top inflection points of the left and middle key lines. The distance between the two points is divided by 4 (the number of tween lines plus one), and that delta allows us to position the top point of each of the tween lines, by adding successively more of the delta.
Let’s add another key line, and see what effect it has.
As you can see, the constraint areas are now divided vertically as well as horizontally. We also note that between the second and third key lines we have six tween lines. I’ve struggled a bit with this: The end key lines are key lines as well, so they ought to have their own set of tween lines on “either side”, just like the other key lines. However, they’re right up against the constraint area of the next key line, so it often gets very crowded there. You can see that in our example, where the second key line on the left is getting very cozy with its end key line.
So I opted for more negative space on end sections. Yes, that’s another bit of nomenclature: the set of lines between adjacent key lines is called a section. Depending on your requirements, either key line, or both even, may be considered part of the section. We’re pretty informal here.
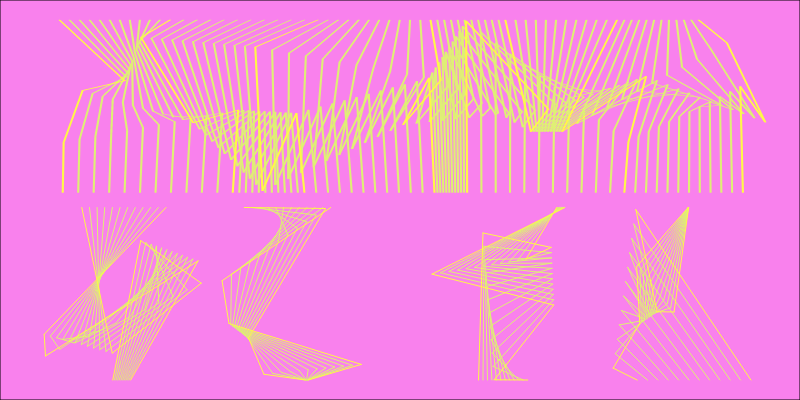
Early on I had conceived of the constraints in both dimensions: horizontal and vertical. But it occurred to me soon afterward to begin experimenting with constraining only in a single dimension, and even of removing the constraints altogether. At the time (mid-80’s), I was rendering these on a plotter, and hadn’t yet started arranging them in arrays; up to now they were single element pieces; and the reduced constraints didn’t appeal very much to me.
Close to thirty years later, using SVG rather than a pen plotter, I very much like the variety the various constraints afford me. Here are some examples; each column is a different constraint. I’m showing the constraint lines across the top row of elements:
So that’s the basic Twisted Geometries. There’s more history and examples here. And some more at Behance. I may write more about it, such as the evolution of the work from 30 years ago to today, the format of the configuration files, the development of the latest effects, such as rainfall and a2b.
For the time being, I’m thinking I could use a break from TG. I’m going to revisit the “vectors” work I did after Digital Origami. I’ll be posting new things on Twitter, Instagram and the Generative subreddit. Follow me there for updates.
A “Thank You”, note.
Just benefited from your post from 2016. I was wondering even if you are alive.
Honestly, just saw your most recent post *this* and decided to say thank you.
So THANK YOU 🙂
Hi Bashir.
Still alive and kicking. Anyone’s guess for how long still.
Glad you got some use from my chicken scratchings.
Live long and prosper, my friend.
– AAA